How to Use the Dashboard Screen Mapper Chrome Extension?
The Dashboard Screen Mapper allows you to display a specific portion of your dashboard instead of the entire webpage. This is perfect for displaying the key metrics from your dashboard and removing unnecessary menus or sidebars.
Installing the Extension
Since the Screen Mapper isn’t currently available in the Chrome Web Store, you’ll need to load it into Chrome manually.
- Download the extension ZIP file here: dashboard-screen-mapper.zip ; please extract the zip file into a desired folder on your computer.
- Open the Google Chrome browser, and type chrome://extensions/ into the address bar and press Enter.
- In the top-right corner of the Extensions page, toggle on Developer mode. New buttons will appear. Click on Load unpacked.
- Select the Folder: In the file selection window, navigate to the folder where you extracted the extension files(dashboard screen mapper folder) and select/open it. The extension will now appear in your list of Chrome extensions.

Pin the Pickcel Dashboard Screen Mapper Extension for quicker access
Using the Extension to Capture an Area
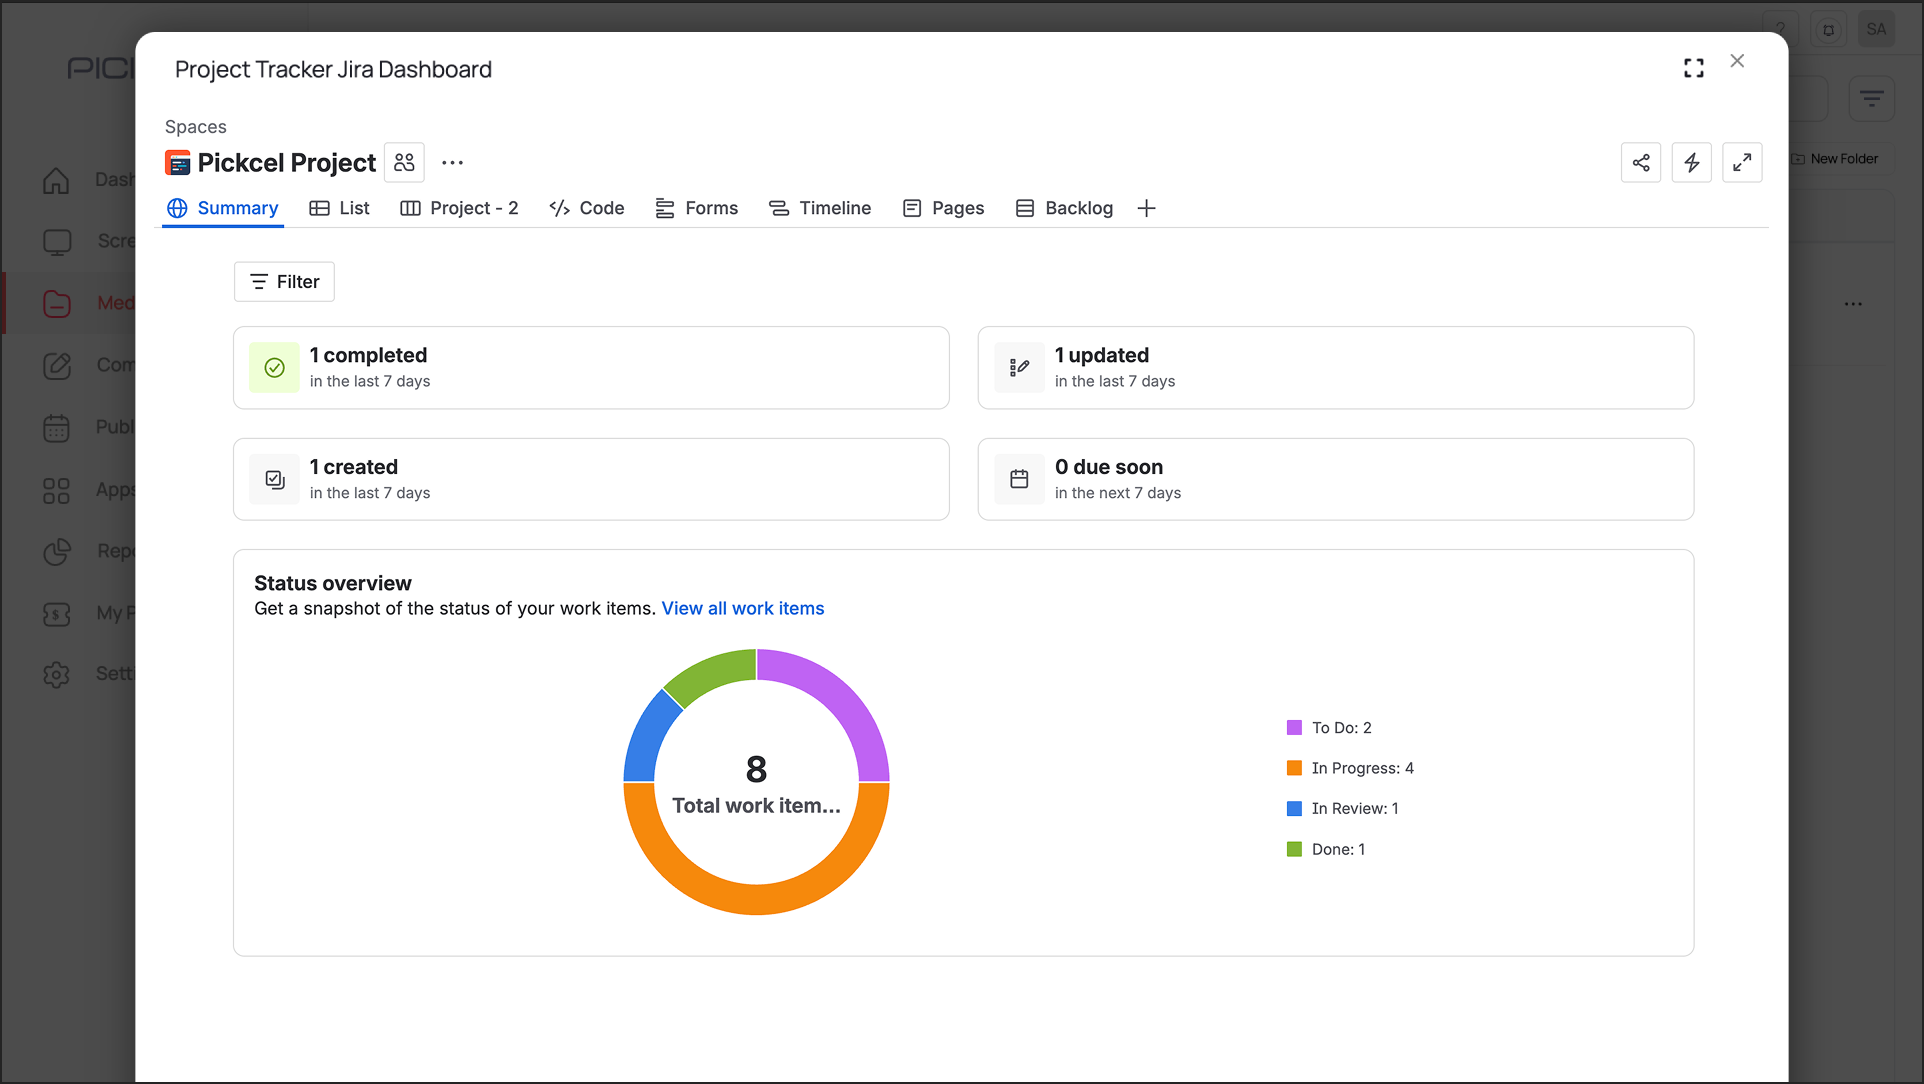
- Open the dashboard page (e.g., in Jira, Power BI, etc.) you want to display.
- Click on the Screen Mapper extension icon from your Chrome toolbar.
- Click the Select Area button. Your mouse cursor will change into a plus sign (+).
- Click and drag your mouse to select the exact portion of the dashboard you want to capture and display on your signage screen.
- Confirm Selection: Once you are happy with the selected area, click the Confirm Selection button.
- A confirmation message will appear, and the necessary selection code will be automatically copied to your clipboard.
- Go back to your Dashboard App configuration in Pickcel Console and paste this code into the Screen Selection Code field.
 If this field is left blank, the entire dashboard will be shown. We recommend enabling the scroll functionality so that everything on the screen is visible.
That's a wrap 🎉. After successful configuration, the selected area of your desired dashboard will be visible on your signage screen.
Related Articles
How to Display a Tableau Dashboard on Digital Signage?
This guide explains how to display your Tableau dashboards on signage screens, allowing you to share powerful data stories and business analytics with a wider audience. Prerequisites: A Tableau account with access to the target dashboard. The full ...How to Display a Power BI Dashboard on Digital Signage
This guide shows you how to display a Microsoft Power BI dashboard on your digital signage screens, perfect for showcasing business intelligence, data visualizations, and key performance indicators. We offer a dedicated Power BI app and recommend ...How to Display a Grafana Dashboard on Digital Signage?
This guide shows you how to display your Grafana dashboards on the big screen, perfect for visualizing time-series data, monitoring system observability, and tracking operational metrics in real-time. Prerequisites: A Grafana account (Grafana Cloud ...How to Display a Zendesk Dashboard on Digital Signage
This guide explains how to display key Zendesk metrics on your digital signage to keep your support team informed about ticket volumes, response times, and CSAT. Prerequisites A Zendesk account with access to the target dashboard Email and password ...How to Display a Jira Dashboard on Digital Signage Using Pickcel?
This guide details how to display a Jira dashboard on your digital signage screens using Pickcel. This is perfect for keeping your teams aligned on sprint progress, issue tracking, and project velocity. Prerequisites: An Atlassian account with access ...