Understanding the Pickcel Dashboard
The Pickcel Dashboard is the first screen you see when you log into the Pickcel console. It is designed to give you a complete, at-a-glance overview of all your screens, their status, and recent activity. The data on the Dashboard updates automatically, but you can also click the Refresh button in the top right corner at any time to see the latest metrics.
As you look at the Dashboard, you will first see four key metrics at the top of the page that provide a quick summary of your account:
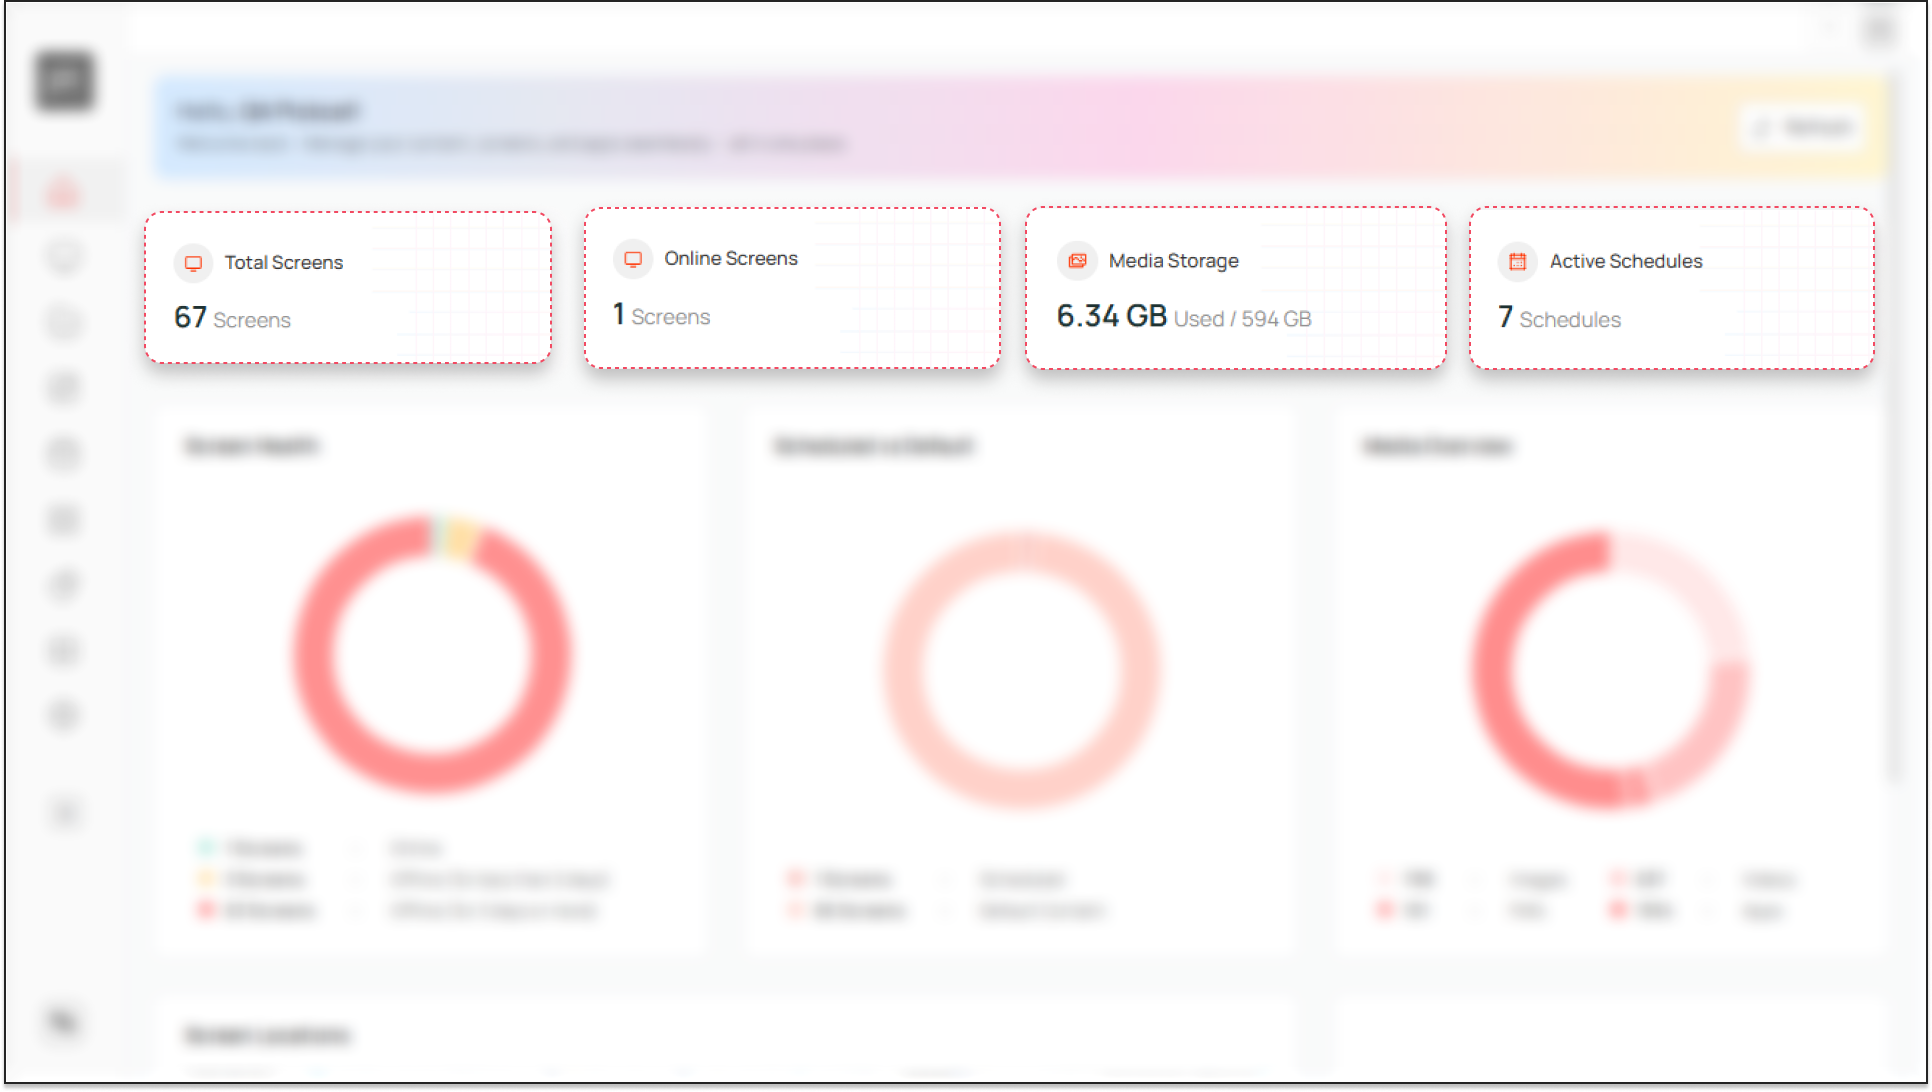
- Total Screens: This is the total number of screens you have registered in the Pickcel console.
- Online Screens: A live count of the screens that are currently connected and actively displaying content.
- Media Storage: This shows how much storage your uploaded media (images, videos, etc.) is consuming versus the total storage available in your subscription.
- Active Schedules: This displays the number of content schedules that are currently live and playing on your screens at this exact moment.
Below these numbers, the charts provide a deeper, visual insight into the status of your screens and content.
Screen Health
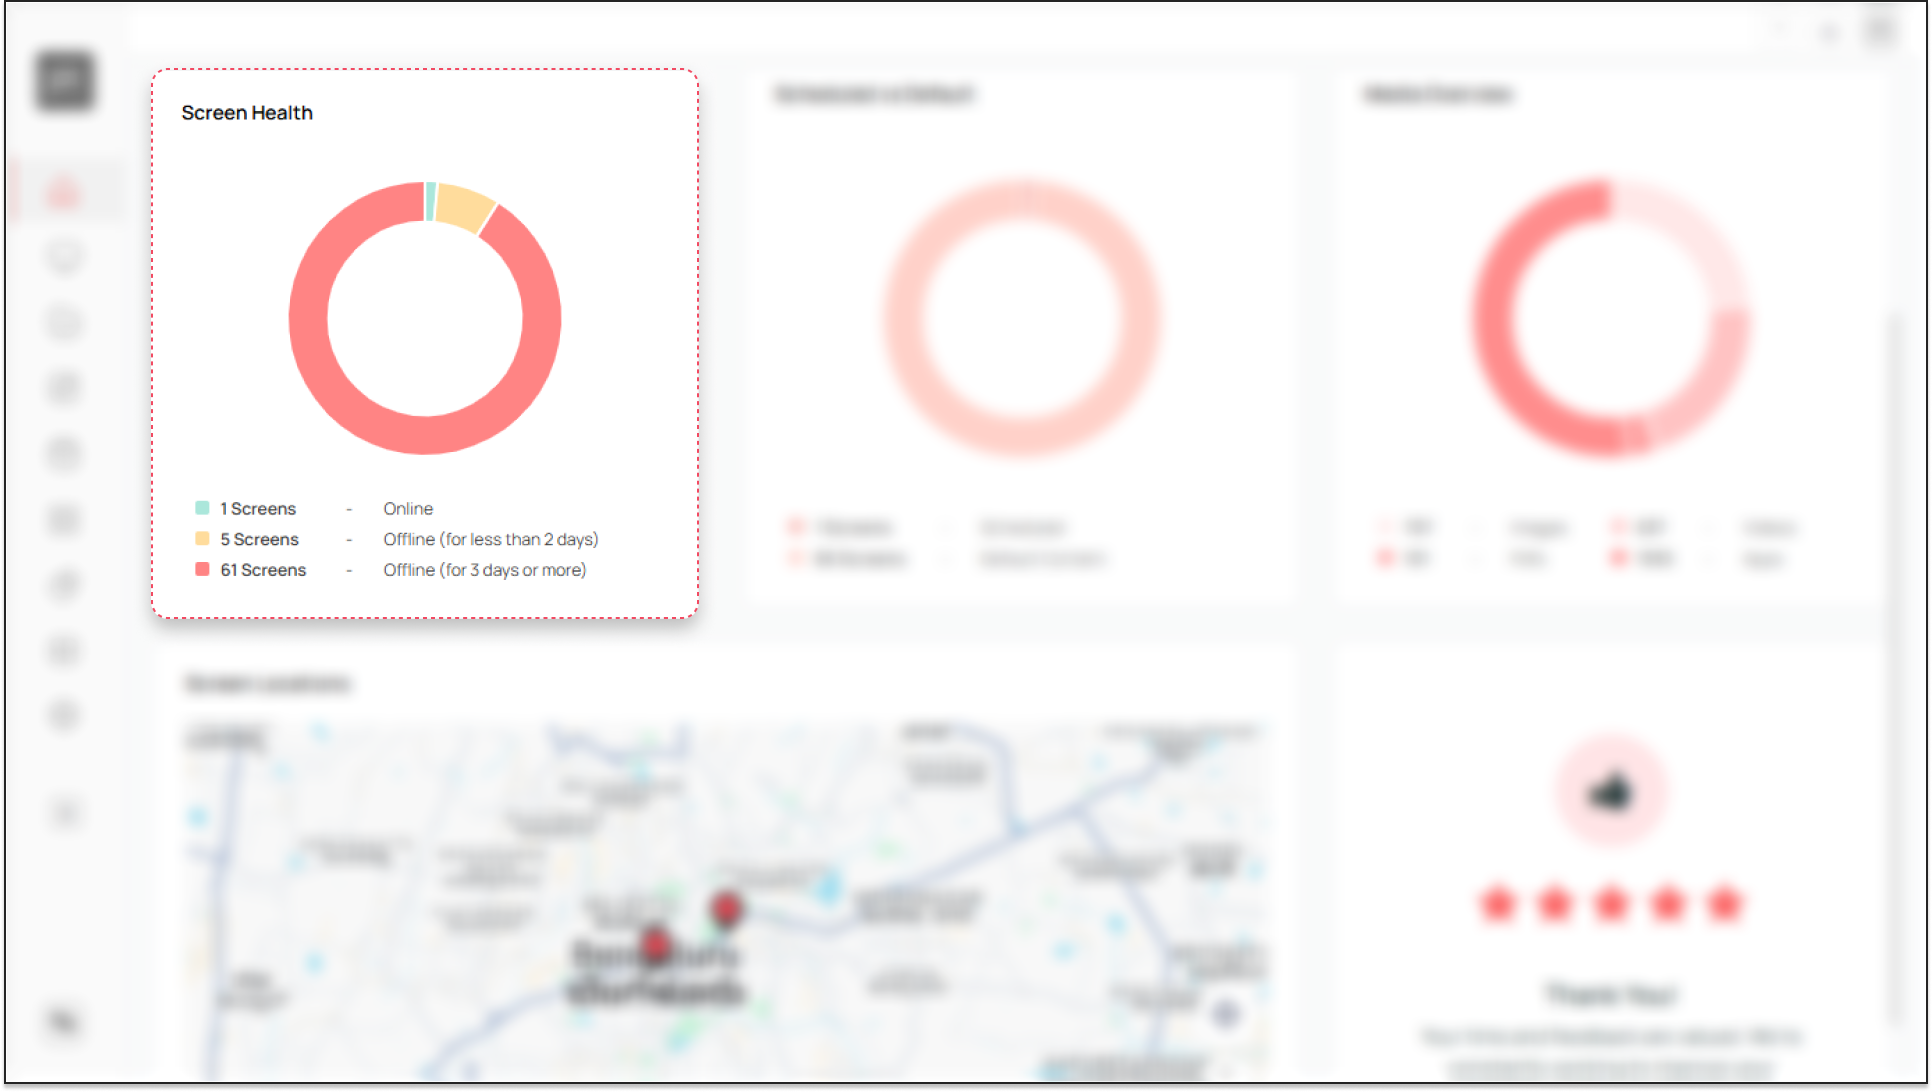
This donut chart gives you a quick visual summary of the operational status for all your screens. It is color-coded for quick understanding:
- Green (Online): Screens that are connected and working correctly.
- Yellow (Offline < 2 days): Screens that have recently lost connection.
- Red (Offline > 3 days): Screens that have been disconnected for an extended period and likely require troubleshooting.
Scheduled vs. Default
This chart shows the playback status of your screens. It displays the number of screens playing Scheduled content (content assigned for a specific time) versus those playing Default Content (content that plays continuously when no schedule is active).
Media Overview
This chart illustrates the distribution of your content library by file type, showing you the proportion of Images, Videos, PDFs, and Apps you have uploaded or created.
Screen Location
Further down the page, you will find the Screen Locations map. This interactive map displays the geographic location of all your registered screens, which is especially helpful if they span multiple areas.
You can click on any red location pin to open a detailed view for that site, which includes the address, a list of screens, their current status, and their last seen time.
Product Feedback
At the bottom of the Pickcel Dashboard, there is a feedback section. We encourage you to rate your experience and leave comments or suggestions. This feedback is invaluable to the Pickcel team as we continuously work to improve the product and your experience.
That's a comprehensive tour of the Pickcel Dashboard!🎉. You're now equipped to monitor your screens and content like a pro.
That's a comprehensive tour of the Pickcel Dashboard!🎉. You're now equipped to monitor your screens and content like a pro.
Related Articles
Understanding Sub-users in Pickcel
Understanding Sub-users in Pickcel A sub-user in Pickcel is any user who is given access to an existing Pickcel account by the Admin. Sub-user access can be controlled using roles and groups, so the Admin can decide what each person can view and ...How to add the App for Slack from the Pickcel App Store?
Pickcel's Slack allows you to show content from your Slack account and a channel where you are a member. 1. Login to your Pickcel account. Click on the Apps module. 2. Search for the app Slack using the Search box and you will find the app "App for ...How to Display a Jira Dashboard on Digital Signage Using Pickcel?
This guide details how to display a Jira dashboard on your digital signage screens using Pickcel. This is perfect for keeping your teams aligned on sprint progress, issue tracking, and project velocity. Prerequisites: An Atlassian account with access ...How to view and edit the Schedule from Screen details?
1. Login to your Pickcel account and screen module will be opened. Select the screen that you want view the schedule of. 2. You can view the name of the schedule in the column Current schedule. You can view more details by clicking on three dots and ...How to Display a Tableau Dashboard on Digital Signage?
This guide explains how to display your Tableau dashboards on signage screens, allowing you to share powerful data stories and business analytics with a wider audience. Prerequisites: A Tableau account with access to the target dashboard. The full ...